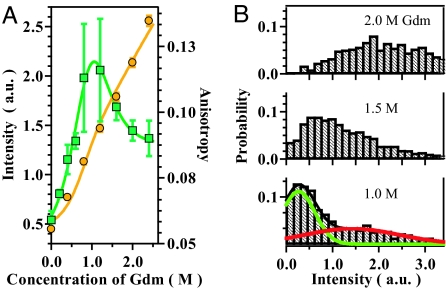
Fig. 4.
The fluorescent data of cyt c-Alexa recorded at the bulk and single-molecule levels in the presence of various concentrations of Gdm. (A) The fluorescence intensities (orange circles) and anisotropies (green rectangles) of cyt c-Alexa recorded by the bulk measurements. The orange and green lines are the fitting of the intensity and anisotropy data, respectively, based on the standard three-state model. (B) The fluorescence intensity histograms obtained for cyt c-Alexa at the single-molecule level. (Upper) Histogram obtained in the presence of 2.0 Gdm. (Middle) Histogram obtained in the presence of 1.5 Gdm. (Lower) Histogram obtained in the presence of 1.0 M Gdm. The excitation laser power was 545 mW for the data of 2.0 M and 480 mW for the data of 1.5 and 1.0 M, respectively. The numbers of the fluorescence images used for the calculation of the histograms for 2.0, 1.5, and 1.0 M of Gdm were 37, 57, and 32, respectively. The residence time of one data point of the original traces was 2 ms per point. The green and red curves represent the fitting of the data recorded in the presence of 1.0 M Gdm based on two Gaussian distributions. The fitted parameters are described in the text.

