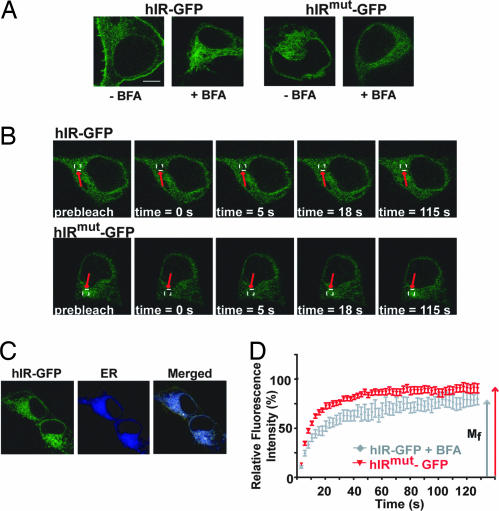
Fig. 6.
Visualization of ER mobility of wild-type and mutant hIR by live-cell imaging. (A) Live 293 cells expressing hIR-GFP or hIRmut-GFP were incubated in media alone or in the presence of 5 μg/ml BFA at 37°C. Images were obtained at ×100 magnification and ×4 zoom. (Scale bar: 10 μm.) (B) Live 293 cells expressing hIR-GFP in the presence of BFA (Upper) or hIRmut-GFP (Lower) were kept at 37°C on a temperature-controlled stage by using a Zeiss LSM 510 laser confocal microscope. FRAP was performed on these cells as described in Materials and Methods. (C) The live cells were incubated with an ER-specific dye (ER Tracker Blue-White) for 15 min at 37°C before FRAP for targeted bleaching of the hIR-GFP within the ER. (D) The ratio between mean fluorescent intensity in the photobleached ER region and in a nonphotobleached region of the cell (relative fluorescent intensity) was plotted as a function of time to generate a fluorescence recovery curve, as described in Materials and Methods.

