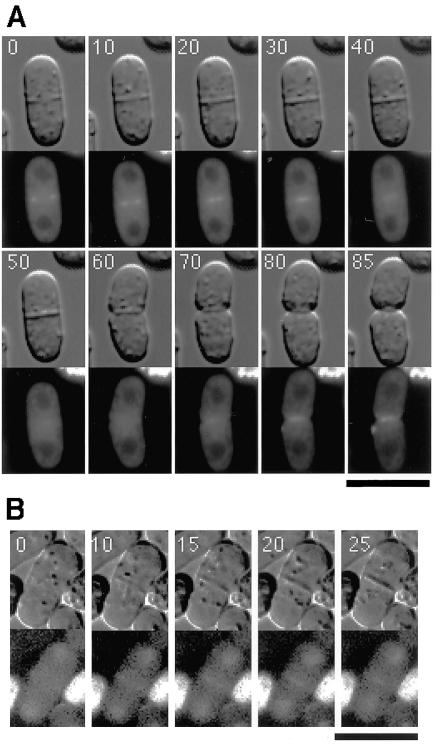
Figure 4.
Time-lapse images of single K193 cells expressing either Gef1p-YFP (A) or Scd1p-GFP (B). Cells were cultured in liquid MM (A) or SD (B) medium to midlog-phase and then mounted on an agarose slab containing the same medium. DIC images (top panels) and fluorescence images (bottom panels) were recorded. Each number indicates the time in minutes from the start of observation. Bar, 10 μm.

