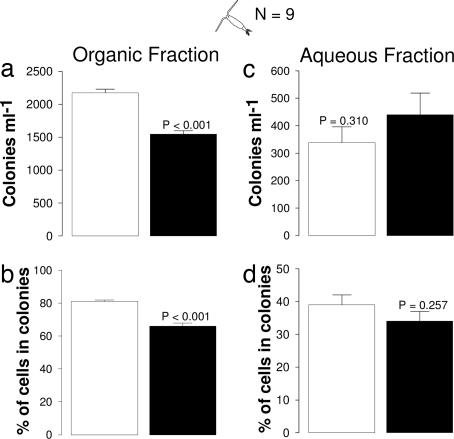
Fig. 4.
Effects of organic or aqueous fractions of filtrates on P. globosa colony concentration (a and c) and percentage of total cells within colonies (b and d). Filtrates sources were either P. globosa cultures (open bars) or P. globosa cultures with A. tonsa (filled bars). P values designate differences between filtrate source (ANOVA). Values are means ± 1 SEM.

