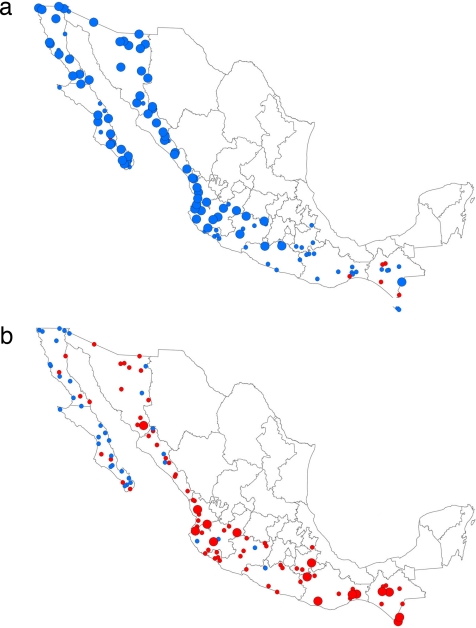
Fig. 2.
Mediterranean and monsoon climate patterns and their relationship with oceanographic conditions. (a) Correlation between mean SOI values for winter-spring and mean precipitation for the same season. (b) Correlation between mean SOI values for summer and mean precipitation for the same season. In both graphs, blue dots indicate negative correlation, and red dots indicate positive values; the large dots indicate statistically significant correlations (P < 0.05).

