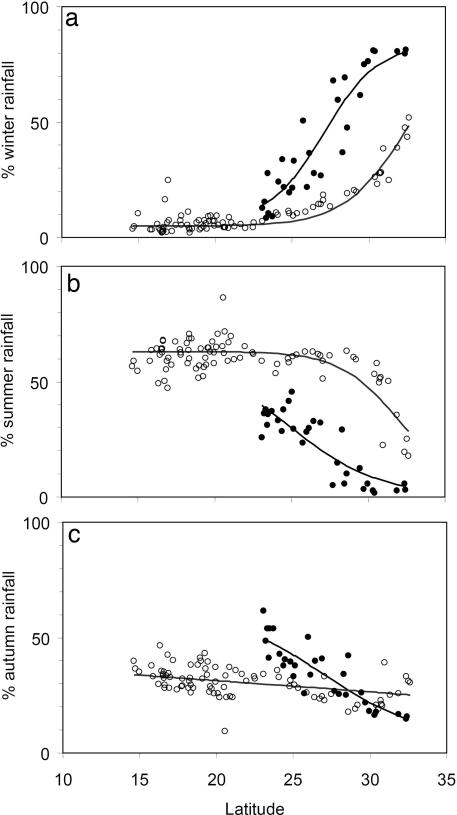
Fig. 4.
Proportion of mean precipitation that falls in winter-spring (a), summer (b), and autumn (c), graphed for all weather stations as a function of latitude. The stations in the peninsula of Baja California are plotted in black circles, and mainland stations are plotted in open circles. The latitudinal trends have been highlighted by fitting a logistic model (P < 0.01 in all cases). Note that, for a given latitude, the influence of winter rains is much higher in the peninsula than in the mainland, where a larger land mass promotes the development of the summer monsoon. Also, note the impact of tropical storms (chubascos) during fall in the Cape Region in the tip of the peninsula.

