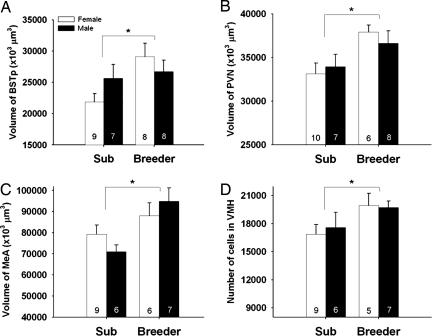
Fig. 2.
(A–C) Mean (± SEM) regional volume of the BSTp, PVN, and MeA and (D) mean cell number in the VMH of subordinate (Sub) and breeder naked mole-rats. Number of animals per group is noted at the base of each bar. An asterisk indicates a significant main effect of social status. No main effects of sex or status-by-sex interactions were detected for any measure.

