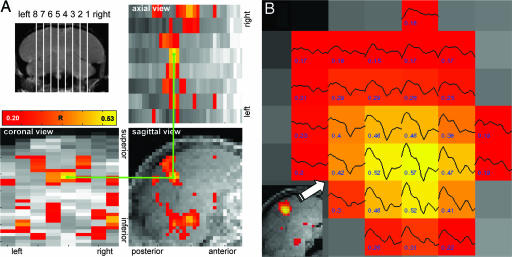
Fig. 1.
Location and time trace of main BOLD response. (A) Slice midlines used to prescribe the fMRI scans (Upper Left) and maximum intensity projections of color-coded correlation coefficients R > 0.2 (P < 0.001), along three orthogonal views, of the brain of a male zebra finch stimulated with a CON (Upper Right and Lower). For demonstration, the green lines connect corresponding voxels in the three views. (B) Cluster of activated voxels in the forebrain area close to the sagittal midline (Inset) of a male zebra finch stimulated with his own song. Colors code the correlation coefficients of the response with the stimulation function, also given as numbers (R > 0.16, P < 0.005). Shown are averaged BOLD response time series with a characteristic shape as expected for this block design paradigm. The average was taken over the 16 stimulation blocks.

