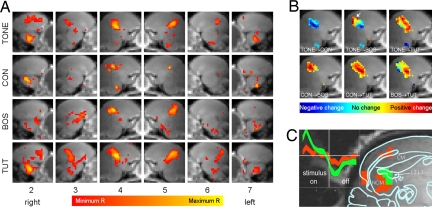
Fig. 2.
Differential topography of activation of auditory areas in response to different stimuli. (A) Averaged functional activations depending on stimulus and sagittal slice position. The slice numbers as corresponding to Fig. 1A are given at the bottom. Functional activations are shown as average correlation coefficients. The grayscale background consists of a representative anatomical volume (smoothed and averaged over both hemispheres). (B) Comparison of averaged activation for different stimuli. Positive changes of the correlation coefficient from stimulus 1 to stimulus 2 are shown in red, and negative changes are in blue, as indicated with the color bar. For example, the stimulation with BOS yields more posterior (red area, arrow) and less anterior (blue) activation than the stimulation with TONE. (C) Example of differences in the shape of the mean BOLD response between primary and secondary auditory areas for stimulation with TUT. Using a simple clustering mechanism based on the strength of activation, the activated area segments into two (noncontiguous) clusters shown in red and green, presumably corresponding to activations in field L (green) and other areas including NCM (red). The corresponding averaged time series within the two clusters, shown in Inset in the same color as the clusters and with 66% confidence intervals, show a distinctively different time course. The anatomical overlay was redrawn from ref. 42.

