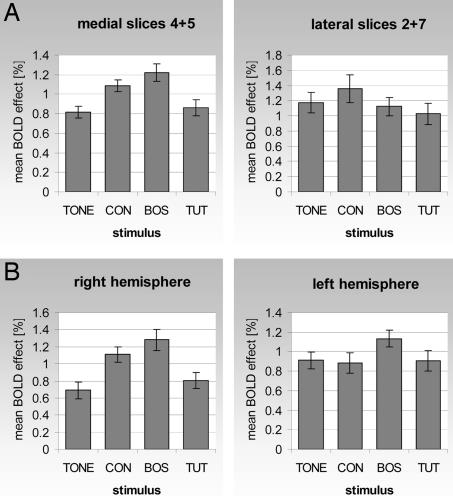
Fig. 3.
Larger mean BOLD response amplitude to BOS compared with TUT and right hemispheric bias in stimulus-dependent topographic differences. (A) Mean and standard error of the BOLD response amplitude over all activated voxels (P < 0.005) in medial slices 4 and 5 and lateral slices 2 and 7, for all 16 birds. The P values of a single-factor ANOVA test across the stimuli are P = 0.0006 for the medial and P = 0.5 for the lateral slices. (B) The same for the right medial slice vs. the left medial slices; P = 0.0005 and 0.2, respectively.

