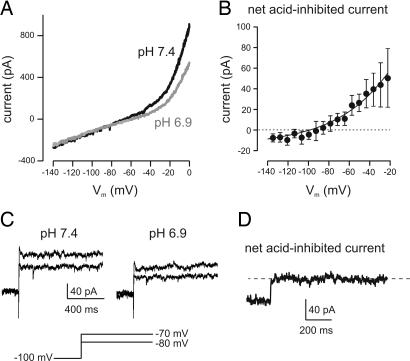
Fig. 5.
Ionic basis of H+ responses of orexin cells. Voltage-clamp whole-cell recordings with K-chloride intracellular solution and bath tetrodotoxin (0.7 μM). (A) Effect of pHe changes on membrane current-voltage relationship of the cell shown in Fig. 4B. The current-voltage relationship was obtained using slow voltage ramps (see Methods). (B) Current-voltage relationship of the net current (n = 4; data are means ± SEM) inhibited by acid (i.e., current in pH 7.4 minus current in pH 6.9). The line through the points is a fit of the Goldman–Hodgkin–Katz equation to the data (see Methods). (C) Effects of pHe on membrane current obtained with voltage-clamp steps (shown schematically below the traces). (D) Time course of activation and inactivation of the net acid-inhibited current (pH 7.4–6.9) obtained by a step to −60 mV (from −100 mV). The trace is representative of results obtained in five cells.

