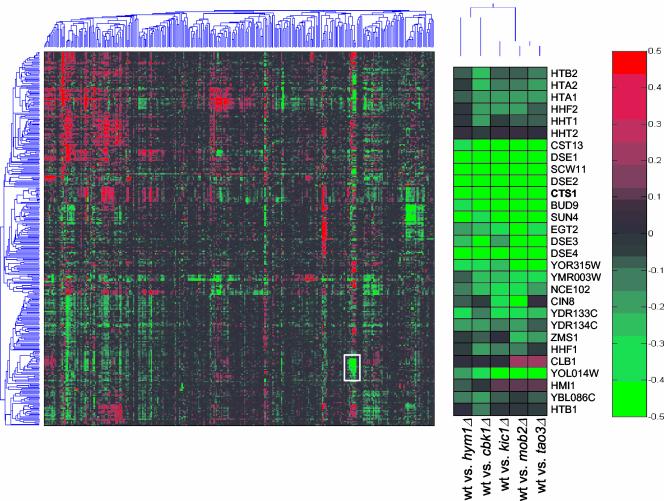
Figure 2.
DNA microarray analysis of RAM deletion mutants. DNA microarray analysis of hym1Δ (Y1614), cbk1Δ (Y1726), tao3Δ (Y3152), kic1Δ (Y3323), and mob2Δ (Y3424) cells show overlapping expression profiles. Logarithmically growing cells were harvested or treated with 50 nM α-factor for 2 h before harvesting. Cells growing for vegetative profiling were grown in synthetic media containing all amino acids, cells treated with α-factor were grown in rich media. Two-dimensional clustering of DNA microarray profiles is presented. Gene expression is measured on a color scale (log10) with increased gene induction (red) or repression (green) corresponding to increased intensity. A gene cluster corresponding to Ace2p regulated genes is enlarged from the two-dimensional clustering for detailed examination (middle).

