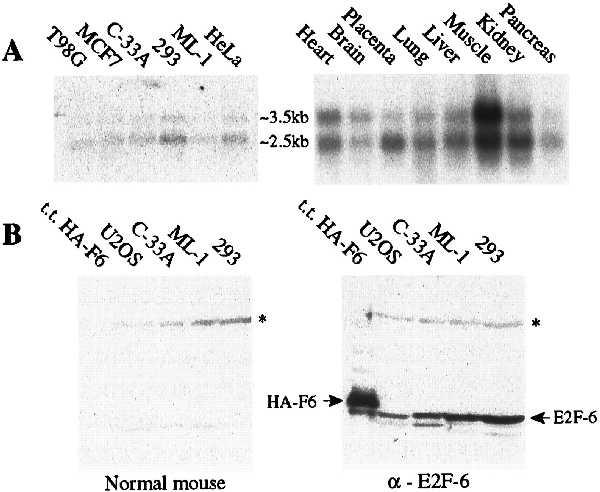
Figure 2.

Expression patterns of E2F-6. (A) Northern blot analysis of poly(A)+ RNA isolated from the indicated cell lines and tissues (human tissue blot from CLONTECH), screened with a probe derived from the full-length E2F-6 coding sequence. (B) Western blot analysis of extracts derived from C33-A cells transiently transfected with pCMV–HA–E2F-6 (200 ng) and from untransfected U2OS, C33-A, ML-1, and 293 cells (50 μg). The positions of HA–E2F-6 and endogenous E2F-6 proteins are indicated by arrows. The band running beneath HA–E2F-6 is a degradation product of this transfected protein (data not shown). The asterisk denotes a nonspecific band.
