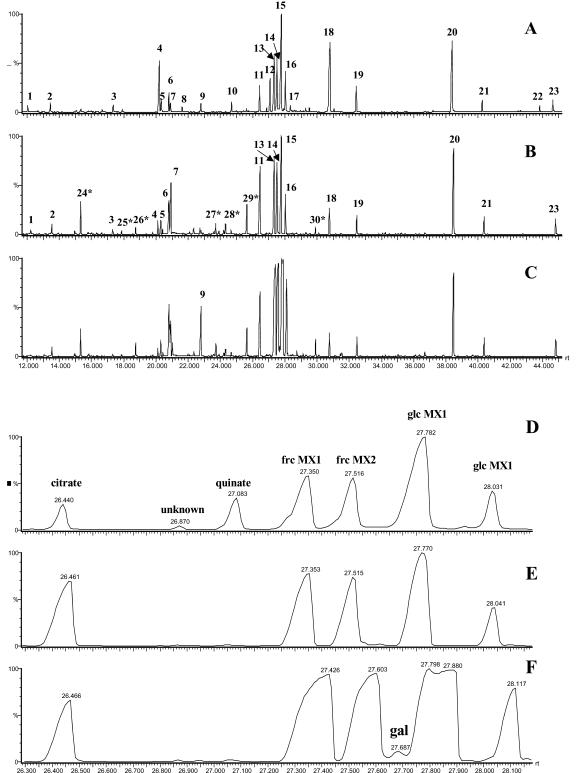
Figure 2.
GC-MS total ion chromatogram of different tissues of wild-type tomato cv MP1. A to C, Complete chromatogram, 12.0 to 50.0 min. D to F, Illustration of sample complexity and analyte range by a representative expansion of chromatograms (A-C) for the region 26.3 to 28.2 min. A and D, Tomato source leaf; B and E, green fruit (30 d after flowering); C and F, Red fruit (60 d after flowering). Peak identification: 1, unknown substance; 2, dodecane (time reference); 3, Ser; 4, malate per-trimethylsilylated (TMS); 5, pentadecane (time reference); 6, Asp TMS; 7, γ-aminobutyrate (GABA) TMS; 8, threonate TMS; 9, Glu TMS; 10, ribitol TMS (quantification standard); 11, citrate TMS; 12, quinate TMS; 13, Fru MEOX1 TMS; 14, Fru MEOX2 TMS; 15, Glc MEOX1 TMS; 16, Glc MEOX2 TMS co-eluting with nonadecane (time reference); 17, gluconate TMS; 18, inositol TMS; 19, docosane (time reference); 20, Suc TMS; 21, octacosane (time reference); 22, chlorogenate TMS; 23, dotriacontane; 24, phosphate TMS; 25, Thr TMS; 26, β-Ala TMS; 27, Asn TMS; 28, unknown substance; 29, Gln TMS; and 30, unknown substance. Derivatives are TMS unless otherwise indicated. Major peaks in the expanded region are identified directly on the chromatogram. An asterisk indicates novel metabolites detected within tomato fruit extracts compared with tomato leaf extracts.

