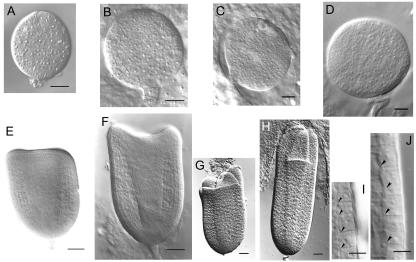
Figure 2.
Comparison of the development of embryo in poc mutant (A, C, E, G, and I) and wild-type plants (B, D, F, H, and J). A and B, Globular stage 10 DAP. C and D, Late globular stage (13 DAP). E and F, Triangular/early heart stage (15 DAP). G and H, Late heart/torpedo stage (18 DAP). I and J, Magnification of medial epidermal cells from the right-hand margin region of embryos shown in E and F, respectively. Arrowheads, Cell boundaries in an epidermal cell file. Scale bars: A to D, 10 μm; E to G, 20 μm; and I and J, 5 μm.

