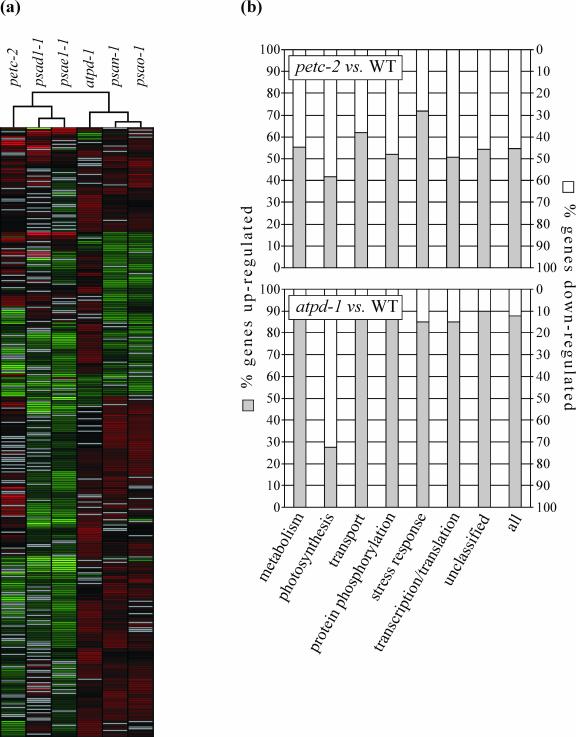
Figure 6.
Effects of petc-2 and atpd-1 mutations on the accumulation of nuclear transcripts encoding chloroplast proteins. a, Hierarchical clustering of the expression profiles of 344 genes that show significant differential expression in at least five of the six mutants petc-2, atpd-1, psae1-1, psad1-1, psan-1, and psao-1. The cladogram at the top summarizes the degree of relatedness between transcriptome responses. Colors indicate up-regulation (red) or down-regulation (green) of gene expression relative to WT. Gray lines indicate non-significant differential expression. For a more detailed image, including gene accession numbers and annotations, see supplementary material 1. b, Fraction of up- and down-regulated genes in seven major functional categories. A complete list of significantly differentially expressed genes is available as supplementary material 3.

