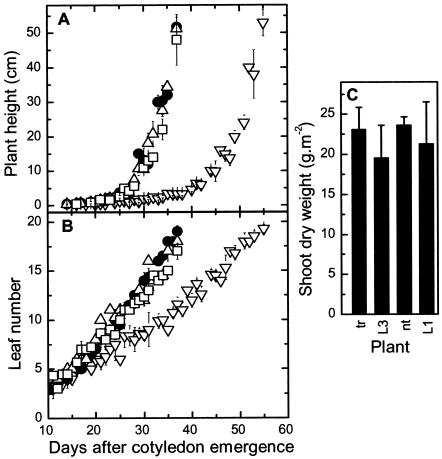
Figure 3.
Comparison of plant growth in 2.5% (v/v) CO2 in air at 240 μmol quanta m-2 s-1. A, Plant height; B, number of leaves per plant (±sd) of T1-generation tobacco-rubrum (tr, ▿, n = 14), LEV3 (L3, □, n = 9), and LEV1 (L1, ▵, n = 9) transformants and nontransformed plants (nt, •, n = 6). C, Shoot dry weight measured 37 d (L1, L3, and nt) and 55 d (tr) after cotyledon emergence.

