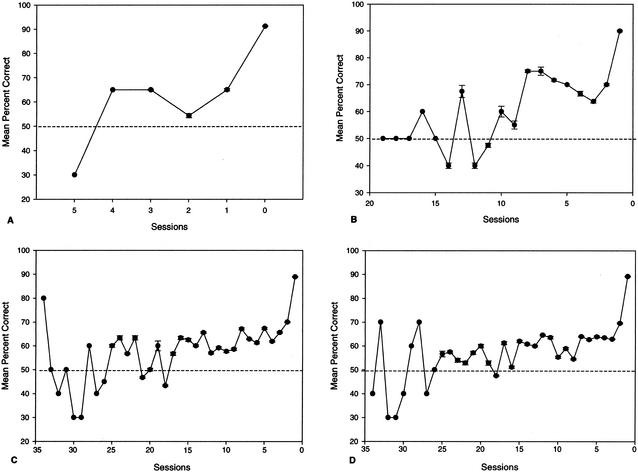
Figure 2.
Backward learning curves for the acquisition of the size discrimination task by young (A), middle-aged (B), old (C), and senior (D) dogs. Data points represent mean percent correct scores (± standard error of the mean) and are plotted backwards from the test session in which criterion is reached (i.e., 0).

