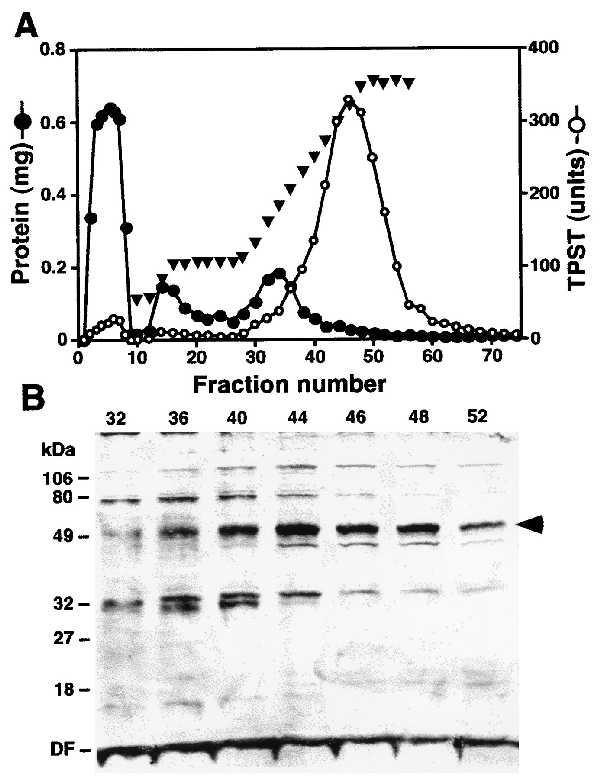
Figure 2.

Purification of rat liver TPST. (A) PSGL-1 peptide column 2 chromatogram. TPST eluted from the first PSGL-1 peptide column was applied to the column and the column was eluted with 0.3 M NaCl followed by a linear 0.3–1 M NaCl gradient in buffer B. (B) SDS/PAGE of PSGL-1 peptide column fractions. Aliquots of the indicated fractions were electrophoresed on SDS/10% polyacrylamide gels under reducing conditions. Proteins were visualized by silver staining. The arrow indicates the protein band that was sequenced. DF, dye front.
