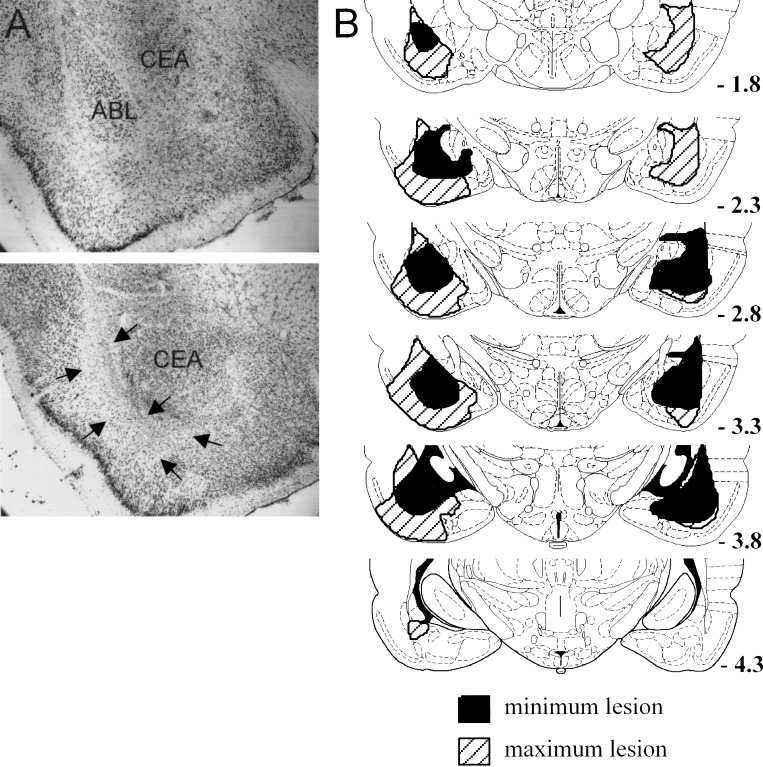
Figure 6.
Photomicrograph and drawings showing a reconstruction of the region of damage in ABL in lesioned subjects. (A) Photomicrograph of coronal sections taken through the amygdala in a control (top) and a lesioned (bottom) rat. The lesioned ABL tissue has undergone substantial shrinkage, causing the central nucleus (CEA) to be displaced laterally. (B) Drawings depict the largest (hatched areas) and smallest (black areas) lesions in each section from animals used in the experiment. Plates are adapted from the atlas of Paxinos and Watson (1997). Arrows denote lesion borders.

