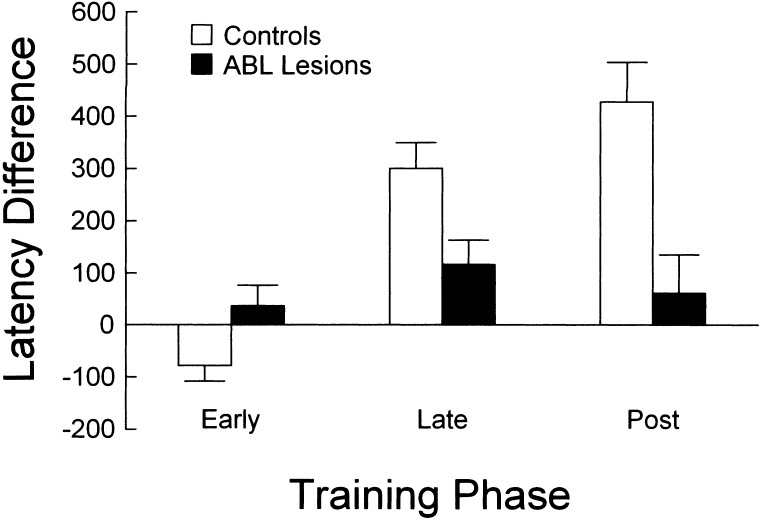
Figure 8.
Difference in latency (milliseconds) to respond at the fluid well after the end of odor sampling for ABL lesioned (black bars) and control (white bars) rats. Difference was calculated as the average response latency on negative minus positive trials within each phase, averaged for the second (D2), third (D3), and fourth (D4) discrimination problems. No-go trials, in which the rat made no response for 3000 msec were excluded from the analysis. ABL-lesioned rats failed to develop the learning-related latency difference exhibited by control rats.

