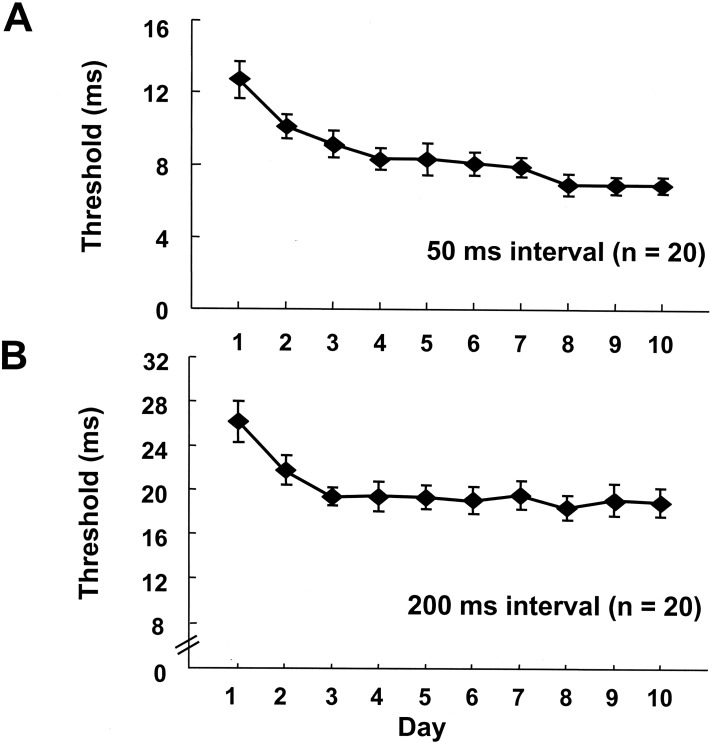
Figure 4.
Parallel learning on two different conditions. (A) Average learning curve for the 50-msec/1-kHz interval for subjects. The curve shows significant learning as measured by orthogonal trend analysis (F1,190 = 49.63, P < 0.001). (B) Learning curve for the 200-msec/4-kHz interval. The average learning is significant (F1,190 = 14.02, P < 0.001). Subjects were trained on the 50-msec and 200-msec intervals simultaneously for 10 d.

