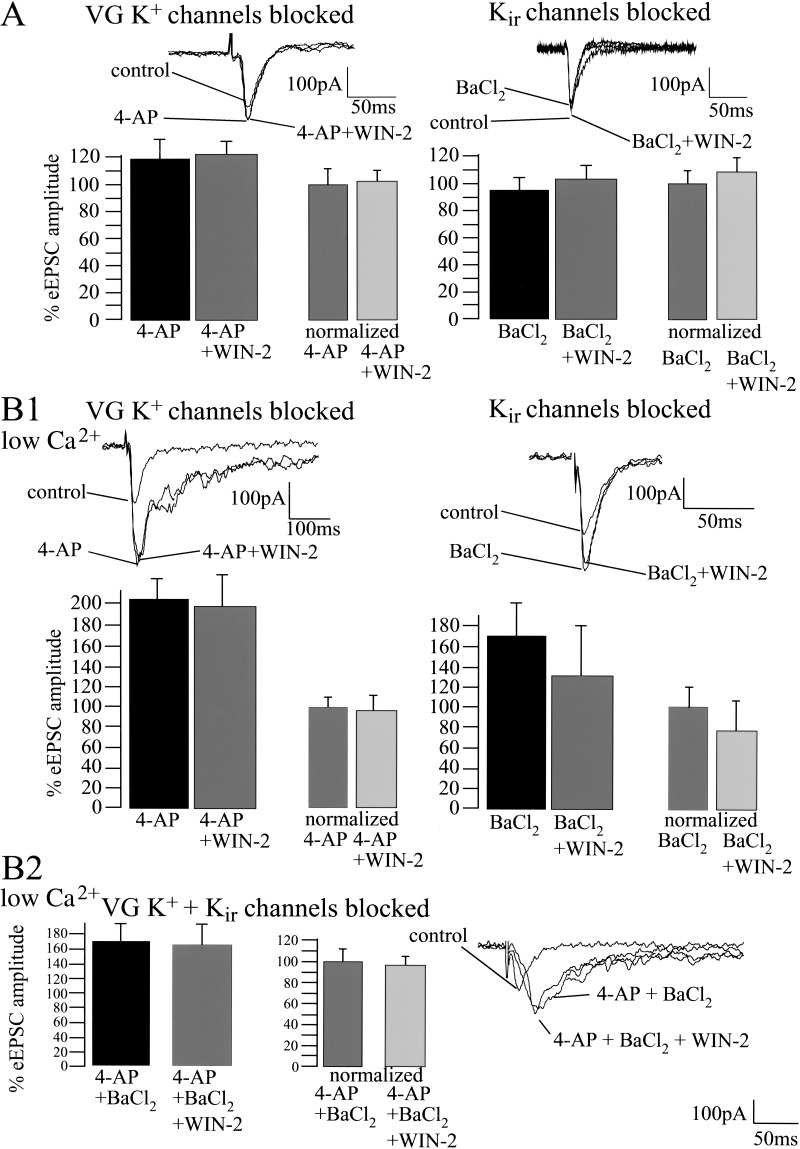
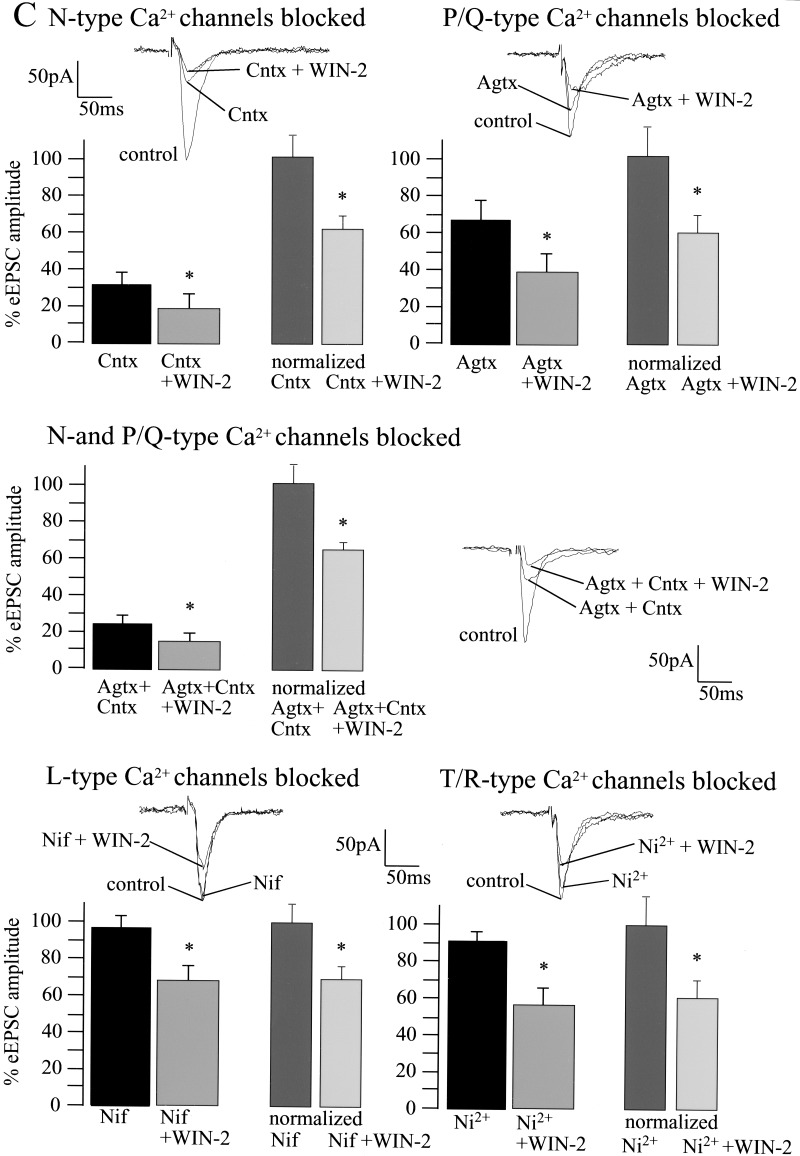
Figure 7.
Cannabinoid-induced decrease of basal synaptic transmission involves the modulation of voltage-sensitive and inwardly rectifying K+ channels, but is unaffected by inactivation of pre- and postsynaptic Ca2+ channels. (A) Whole-cell recordings reveal that 4-AP (100 μM; control, 100%; 4-AP, 119 ± 14%; n = 5; P > 0.05) and BaCl2 (control, 100%; BaCl2, 96 ± 6%; n = 6; P > 0.05) slightly affect basal synaptic transmission. Both 4-AP and BaCl2 inhibit the effect of WIN-2 (5 μM) on eEPSC amplitude (4-AP, 100%; 4-AP + WIN-2, 103 ± 10%; n = 5; P > 0.05; BaCl2, 100%; BaCl2 + WIN-2, 108 ± 8%; n = 5; P > 0.05). (B1,B2) Under conditions in which the extracellular Ca2+ concentration is decreased to 0.5 mM, both K+ channel blockers increase eEPSC amplitudes markedly (baseline, 100%; 4-AP, 201 ± 20%; n = 4; P < 0.05; baseline, 100%; BaCl2, 169 ± 26%; n = 4; P < 0.05) and inhibit WIN-2 action on synaptic transmission (4-AP, 100%; 4-AP + WIN-2, 94 ± 15%; n = 4; P > 0.05; BaCl2, 100%; BaCl2 + WIN-2, 78 ± 28%; n = 4; P > 0.05). Similar results are obtained when both 4-AP and BaCl2 are applied together (baseline, 100%; 4-AP + BaCl2, 168 ± 23%; n = 4; P < 0.05; 4-AP + BaCl2, 100%; 4-AP + BaCl2 + WIN-2, 98 ± 22%; n = 4; P > 0.05). (C) Blockade of presynaptic N- and P/Q- type Ca2+ channels with ω-Conotoxin (Cntx; 1 μM) and ω-Agatoxin (Agtx; 200 nM) reduce eEPSC amplitudes to 31 ± 6% (n = 4; P < 0.05) and 66 ± 11% (n = 5; P = 0.05), respectively. Blockade of postsynaptic L- and R/T-type Ca2+ channels with Nifedipine 20 μM (control, 100%; Nifedipine, 94 ± 6%; n = 4; P > 0.05) and Ni2+ 50 μM (control, 100%; Ni2+, 90 ± 5%; n = 5; P > 0.05) does not affect eEPSC amplitude. Neither pre- nor postsynaptic Ca2+ channel blockers affect the WIN-2-induced decrease of the eEPSC amplitude (Cntx, 100%; Cntx + WIN-2, 60 ± 8%; n = 5; P < 0.05; Agtx, 100%; Agtx + WIN-2, 59 ± 11%; n = 5; P < 0.05; Cntx + Agtx, 100%; Cntx + Agtx + WIN-2, 67 ± 7%; n = 4; P < 0.05; Nifedipine, 100%; Nifedipine + WIN-2, 66 ± 10%; n = 5; P < 0.05; Ni2+, 100%; Ni2+ + WIN-2, 63 ± 9%; n = 5; P < 0.05). All bars reflect mean ± SEM.


