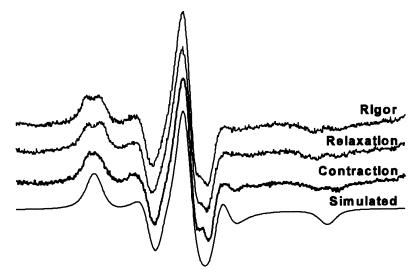
Figure 2.
EPR spectra of randomly oriented fibers. Spectra shown (from top, down) are fibers in rigor, relaxation, contraction, and simulation of the best fit to the rigor experimental spectrum. The simulated spectrum has a Lorentzian line width of 2.2 G, Gaussian line width of 2.8 G, anisotropic T values Tzz = 29.9 G, Tyy = 9.8 G, and Txx = 8.3 G, and g values gxx = 2.0072, gyy = 2.0068, and gzz = 2.0035.

