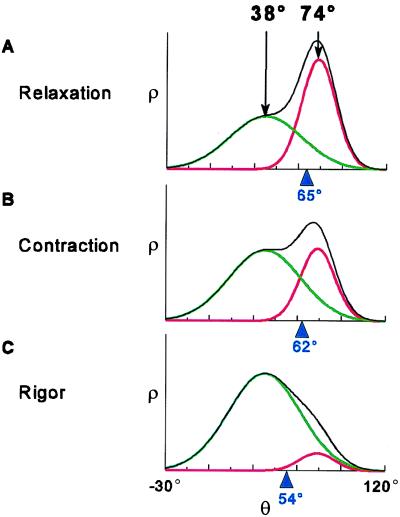
Figure 5.
The overall angular distribution ρ(θ) (Eq. 1, plotted in black), of spin-labeled LC domain in scallop fibers for different physiological states, showing contributions from the two oriented components, ρ1 (red) and ρ2 (green), as determined from the EPR spectra in Fig. 2. The average value of θ for the overall distribution, 〈θ〉 = ∫θsin(θ)ρ(θ)dθ, is indicated in blue. (A) Relaxation: ρ1 and ρ2 are both populated. (B) Contraction: the distribution shifts toward ρ2. (C) Rigor: ρ2 is predominant.

