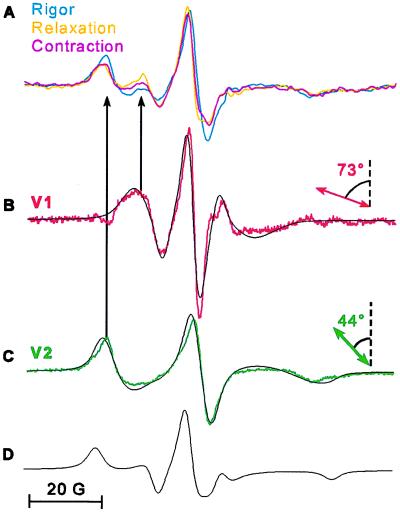
Figure 7.
EPR spectra of spin-labeled rabbit muscle fibers. (A) Spectra overlaid in rigor (cyan), relaxation (orange), and contraction (magenta). (B and C) Orientational components V1 (red) and V2 (green) were obtained as in Fig. 2, with the additional subtraction of up to 40% of a powder spectrum (D). Black spectra in B and C are the best-fit simulations of Gaussian distributions centered at 73 ± 5° and 44 ± 5° with full width at half-maximum of 24 ± 5° and 40 ± 5°, respectively.

