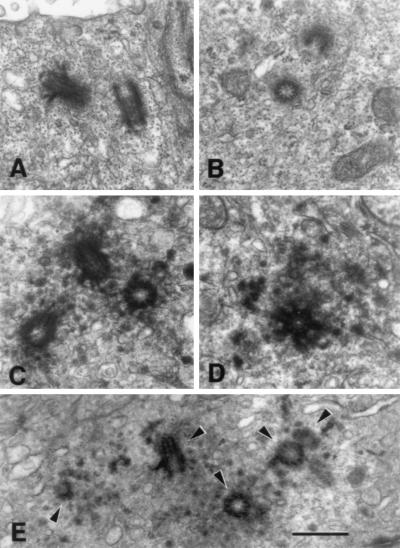
Figure 3.
Normal and tumor centrosome ultrastructure. Electron micrographs of thin sections of normal epithelial cell centrosomes (A–B) and centrosomes of tumor cells (C–E). (A) A normal epithelial cell centrosome illustrating the orientation of the pair of centriole cylinders and sparse pericentriolar material surrounding them. (B) A centrosome of another normal breast epithelial cell illustrating two centriole profiles and sparse pericentriolar material. The three tumor cell centrosomes illustrated in C–E show large accumulations of densely staining pericentriolar material with numerous centrioles and procentrioles. (E) A section of a tumor centrosome that includes five centriole and procentriole profiles (arrowheads). (Bar = 0.5 μm.)

