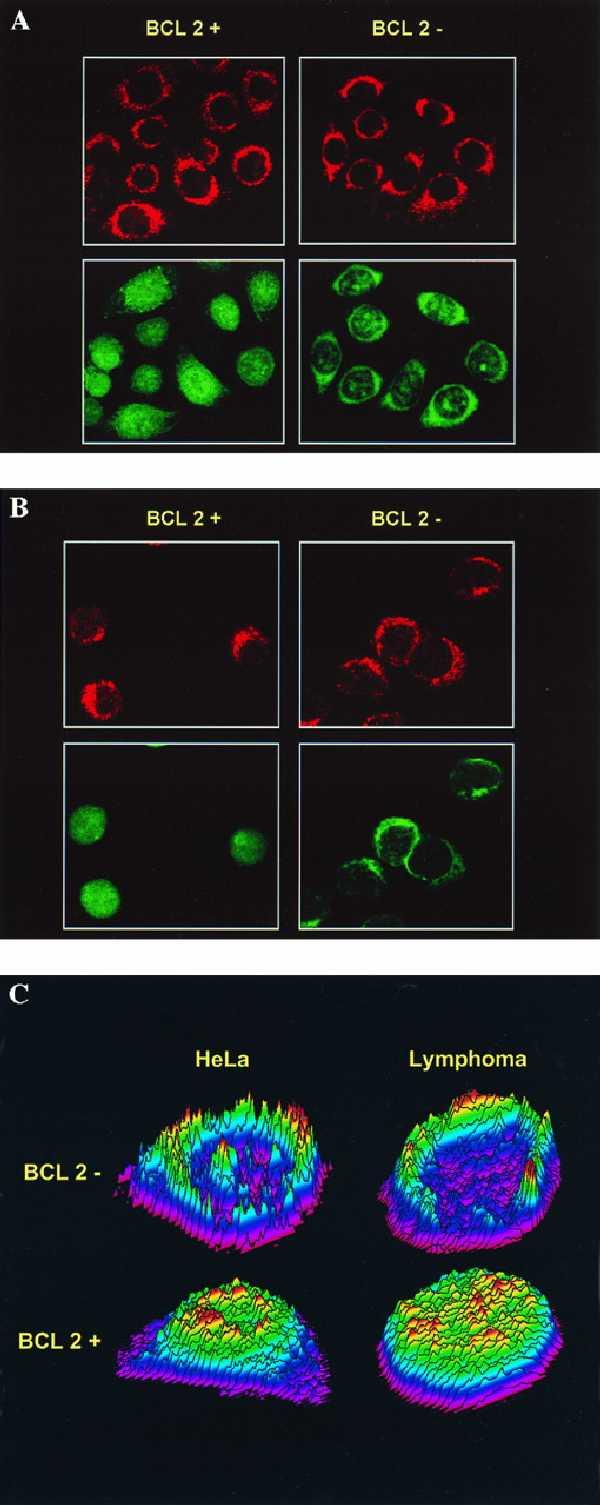
Figure 2.

Confocal analysis of GSH and mitochondria staining in HeLa/Tet-Bcl-2 (A) and LYar/LYas (B) cells with CMFDA and MTX. HeLa/Tet-Bcl-2 and LYar/LYas cells were dual labeled with CMFDA to stain GSH and MTX to stain mitochondria. (A Left) HeLa cells grown on chamber slides in the absence of Tet. (A Right) HeLa cells grown for 48 h in the presence of 2 μg/ml Tet. (B Left and Right) Cytospins of LYar and LYas, respectively. (A and B Upper) Cells scanned for red fluorescence to detect mitochondria. (A and B Lower) Cells scanned for green fluorescence to detect GSH staining. Green fluorescence indicates localization of GSH to the nucleus when the Bcl-2 protein level is high that is not seen when Bcl-2 is low. Multiple slides were labeled during many experiments, and reported scans are representative of what was observed. (C) Topographical color relief map of GSH localization in HeLa/Tet-Bcl-2 and LYar/LYas cells. Z-sections from confocal images of cells expressing high and low levels of Bcl-2 are shown. (Upper) HeLa/Tet-Bcl-2 (Left) and LYas cells (Right), which have low levels of Bcl-2 protein expression. (Lower) HeLa cells with Bcl-2 derepressed (Left) and LYar cells (Right), which express high levels of Bcl-2. Gray scale images of CMFDA dye intensity measured in 2-μm z-sections were converted to pseudocolor and plotted in the z axis.
