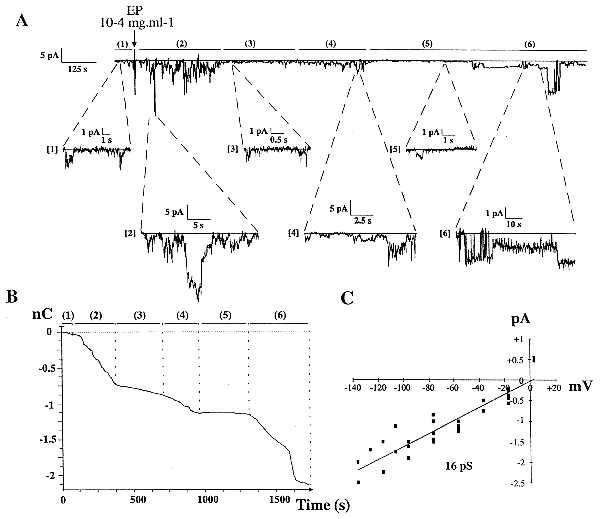
Figure 1.

EP-induced single channel inward currents recorded from cell-attached membrane patch on HUVEC, seen as downward deflections from baseline. (A) EP-induced inward currents (filtering 1 kHz, sampling 3 kHz). This recording is typical of 20 similar experiments performed on 20 different cells from 20 different culture dishes (Upper). EP (final concentration 10−4 mg⋅ml−1) induced cyclic bursts of inward current [periods (2), (4), and (6)] separated by low activity periods [periods (3) and (5)]. Below, magnified parts of the recorded trace are shown: 1 min before, then 1, 6, 14, 19, and 25 min after EP addition. (B) Integration of inward current recording presented in Fig. 1A. High activity periods [periods (2), (4), and (6)] exhibit charge inward 3- to 30-fold higher than those measured in low activity periods [periods (1), (3), and (5)]. (C) Current-voltage relationship, obtained by linear regression from pooled data of five patches, exhibiting 16 ± 1 pS channels with reversal membrane potential in the range of 1.5 mV.
