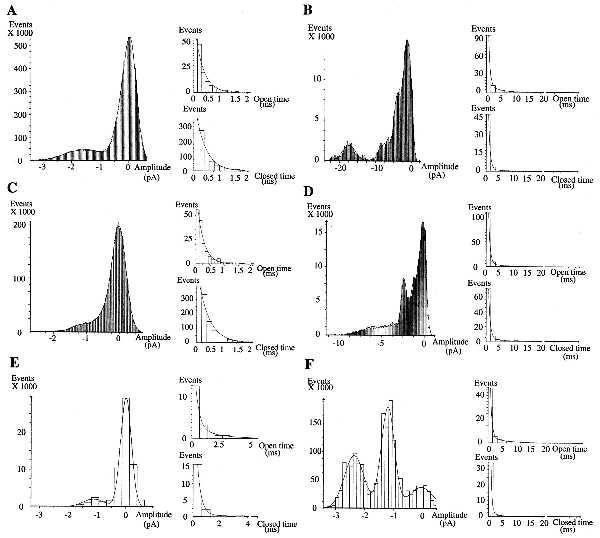
Figure 2.

Amplitude and kinetic analyses of the patch-clamp recordings. A–F correspond respectively to the extracts [1] to [6] presented in Fig. 1A downward. Probability density histograms (Left) exhibited unitary current amplitude of ≈1.2 pA. Kinetic analysis of low activity periods (A, C, and E) exhibit only short lasting decay constants (Right), except for (E), and no presence of multiunitary open states (Left). Unitary open state decay constants (Right, Upper) are 0.31 ms (A), 0.24 ms (C), 0.32 ms (E, short) and 1.9 ms (E, long). Corresponding closed state decay constants (Right, Lower) are: 0.37 ms, 0.40 ms, 0.27 ms (short), and 3.4 ms (long), respectively. By contrast, high activity periods (B, D, and F) exhibit the presence of numerous multiunitary open states (Left) and of both short and long decay constants (Right). Short and long open state decay constants are (Upper): 0.53 ms/4 ms (B), 0.57 ms/5.4 ms (D), and 0.58 ms/6 ms (F), respectively, whereas corresponding closed state decay constants (Lower) are: 0.58 ms/7 ms (B), 0.60 ms/4.7 ms (D), and 0.44 ms/3.6 ms (F).
