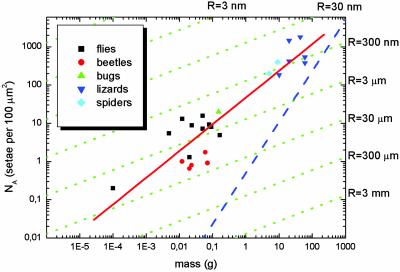
Fig. 3.
Interpretation of Fig. 2 in light of contact theory. A fit to all data (red line) gives a slope of ≈2/3, corresponding to the self-similarity criterion. Within each lineage, a lower slope of ≈1/3 is found, suggesting curvature invariance of the contacts with radius R (green lines). The approximate limit for such attachment devices (limit of maximum contact) is shown as a blue line.

