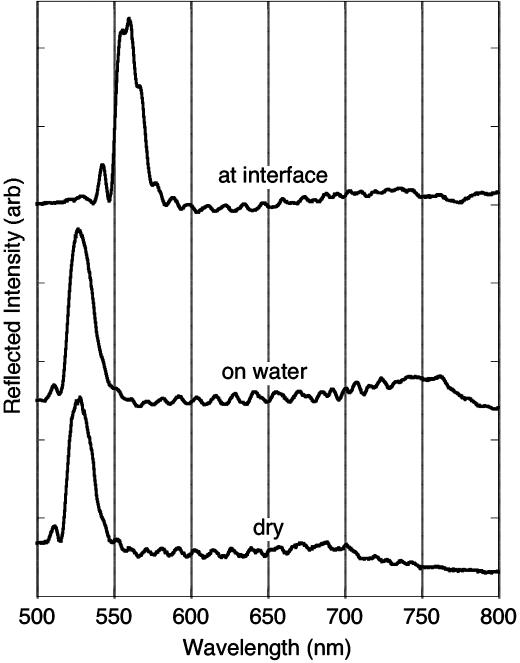
Fig. 3.
Reflectivity spectra of the hydrophobic (alkylated) side of the bifunctional porous Si film from Fig. 2. The bottom trace (“dry”) is the same data represented by the solid line in Fig. 2 obtained with the sample in air. The “on water” trace represents the spectrum of the hydrophobic side of the sample when it is floating on water (obtained by looking down on the sample from above). The “at interface” trace represents the spectrum of the sample sitting at the water–heptane interface (obtained by looking through the heptane phase). Spectra are offset along the y axis for clarity. arb, arbitrary.

