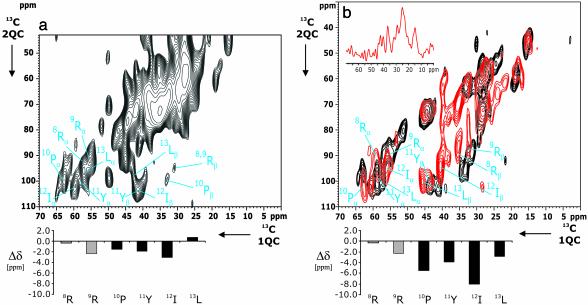
Fig. 3.
2D 13C-13C (2Q,1Q) correlation experiments for the two [13C,15N]-NT(8–13)/receptor preparations NT/NTS-1A (a) and NT/NTS-1B (b, in red). In both cases, 32 t1 experiments were recorded by using tppm (42) decoupling in evolution and detection periods. Residue assignments are given in single-letter notation. Similar to Fig. 2, POST-C7 recoupling was used for 2Q excitation and reconversion. (a) A total of 13,568 scans were accumulated for each t1 experiment. (b) A total of 11,136 scans were coadded in t2. Below each 2D correlation spectrum, secondary chemical shifts Δδ as obtained from Table 1 are given. Arg-8 and Arg-9 Δδ values are shaded to indicate that secondary chemical shifts here are only tentatively assigned. (b) A 1D slice along the t1 axis (54 ppm, indicated in red) and results from frozen [13C,15N]-NT(8–13) (see Fig. 2b) are included in black for reference. Additional information is given in Fig. 9, which is published as supporting information on the PNAS web site.

