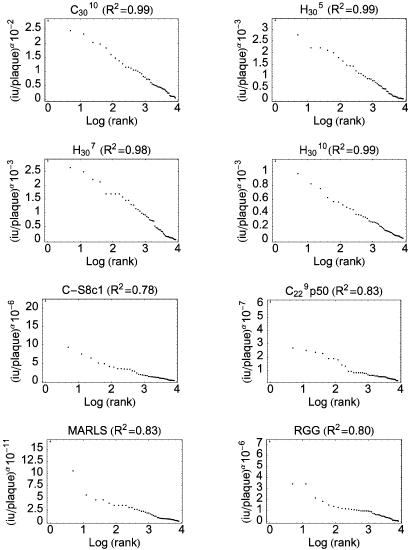
Fig. 5.
Representation of the values of infectious units per ml per plaque (iu/plaque) as a function of the logarithm of the rank. The data series were ordered by decreasing values and raised to the power α that was obtained from the fitting of the frequency values to a Weibull distribution (ref. 30, see Table 2).

