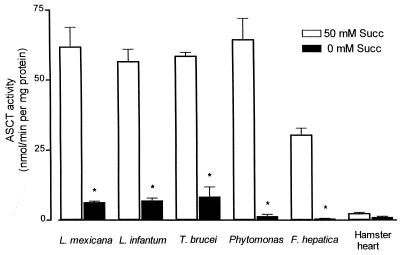
Figure 3.
The ASCT activity in trypanosomatids, F. hepatica, and hamster heart. ASCT activity was determined as described in Materials and Methods. Open bars represent the activity (acetate production) in the presence of 50 mM succinate, whereas closed bars represent the activity in the absence of succinate. Shown are the means ± SD of three independent experiments; ∗, significantly different from the ASCT activity in the presence of succinate. P < 0.0005.

