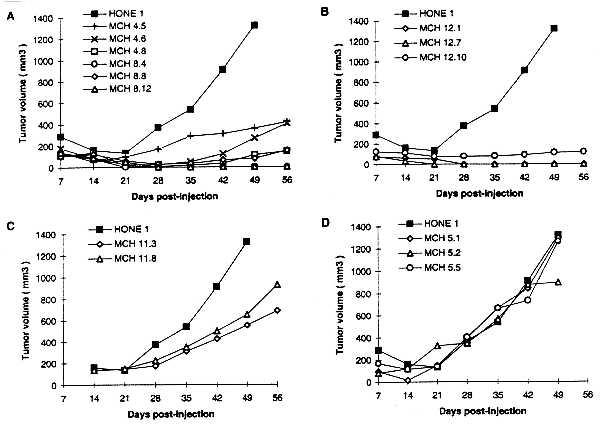
Figure 4.

Kinetics of tumor formation of parental HONE1 cells and HONE1–chromosome 3 microcell hybrid clones. The curves represent an average of the tumor volumes of all sites inoculated for each cell population. The identity of the cell lines tested is in Table 1, as well as more detailed information on the degree of tumor suppression.
