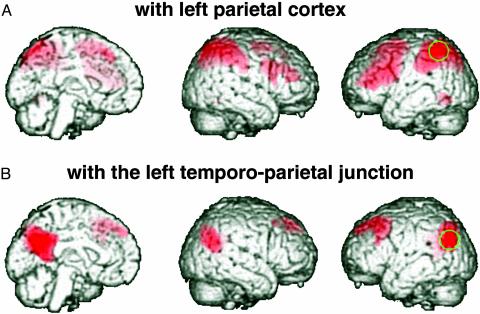
Fig. 2.
Brain regions where BOLD fMRI signal at rest correlates with the reference regions indicated in green (stereotactic coordinates: A, –50, –52, 50; B, –36, –62, 36). The image data set is the same as in Fig. 1, and the functional connectivity results are visualized at a height threshold of T = 10.00.

