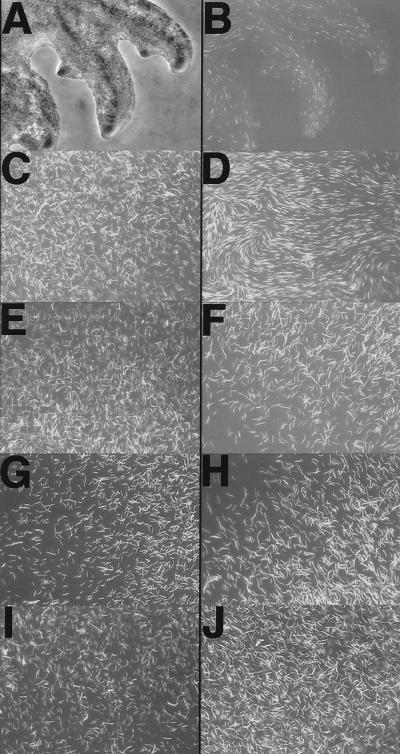
Figure 4.
Motility and cell orientation visualized by fluorescence microscopy of green fluorescent protein (GFP)-labeled cells. GFP+ cells were mixed 1 to 50 with nonfluorescent cells and placed on 1/2 CTT plates (1 ml in 50 × 9-mm Petri dish) and incubated at 33°C. (A) Phase contrast image of S-motility flares (DK1217 and DK8605). (B) Fluorescent image of A. (C) Fluorescent image of A-motile (DK10410) cells mixed with nonmotile nonstimulatable GFP+ (DK8606) cells immediately after the cell suspension fluid had dried on the 1.0% agar. (D) Same as C after 4 hr. (E) Same as C, except DK8601 was mixed with nonmotile DK8606 (aglB1 ΔpilA). (F) Same as E after 4 hr. (G) Same as C, except DK8601 was mixed with nonmotile DK8603 (ΔmglBA ΔpilA). (H) Same as G after 4 hr. (I) Same as C, except cell suspension was placed on 0.5% agar. (J) Same as I after 4 hr.

