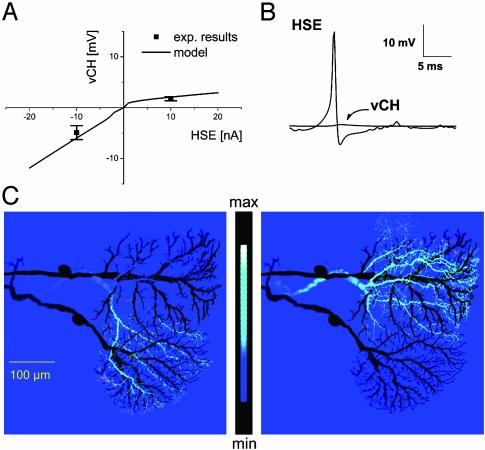
Fig. 2.
Calibration and validation of the model. (A) I–V curve (current injection in HSE, voltage response in vCH). The model follows the rectification observed in real cells. (B) Action potentials in HSE model do not travel to the vCH model axon. (C) Current injection into HSS (Left) and in HSE (Right) results in a localized potential change only in the respectively superimposed dendrites of vCH. Potential change in vCH model is shown as a false-color image. The anatomy of HSS and HSE is outlined in black.

