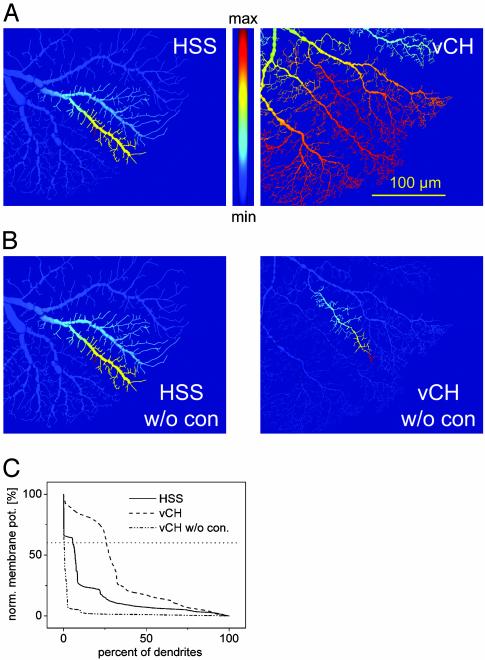
Fig. 3.
Example of the blurring effect of the HS–CH connection. (A) Potential spread in HSS model (Left) and vCH model (Right) after local current injection into HSS. (B) Same as A, but HSS and vCH models were not connected to each other. Current was injected in HSS (Left) and vCH (Right). (C) Quantification of model results: ranked membrane potential distribution in HSS and vCH model dendrites, connected and unconnected. For example, 6% of HS dendrites and 26% of vCH dendrites are >60% of the maximum potential (dotted line) when connected to each other. When current is injected into an unconnected vCH model, only 0.37% of its dendrites are >60% of the maximum potential.

