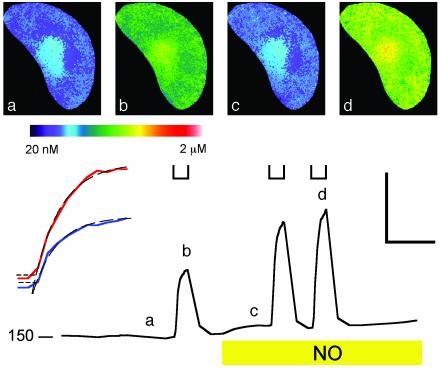
Fig. 4.
NO promotes evoked [Ca2+]i increases without affecting [Ca2+]i recovery. (Lower) [Ca2+]i recorded from one guard cell clamped to -50 mV and stepped to -200 mV at time periods indicated ([unionsq]) before and after adding 10 μM SNAP show enhanced [Ca2+]i rise but no apparent change in recovery kinetics at -50 mV. (Lower Left) [Ca2+]i basal level in nM. Fura 2 fluorescence images taken at 2-s intervals. (Upper) Selected ratio images (a–d) correspond to the time points indicated. (Lower Left Inset) Expanded analysis of [Ca2+]i rise from 2 s before -200 mV steps. -NO (blue) and +NO (red) show no change in lag time. The data points above +1 SD from mean [Ca2+]i before clamp step (horizontal dashed lines) fitted to single exponentials gave equivalent lag periods and rise half-times of 4.2 s despite the difference in amplitudes. [Scale: horizontal, 1 min (Lower Left Inset, 10 s); vertical 400 nM.]

