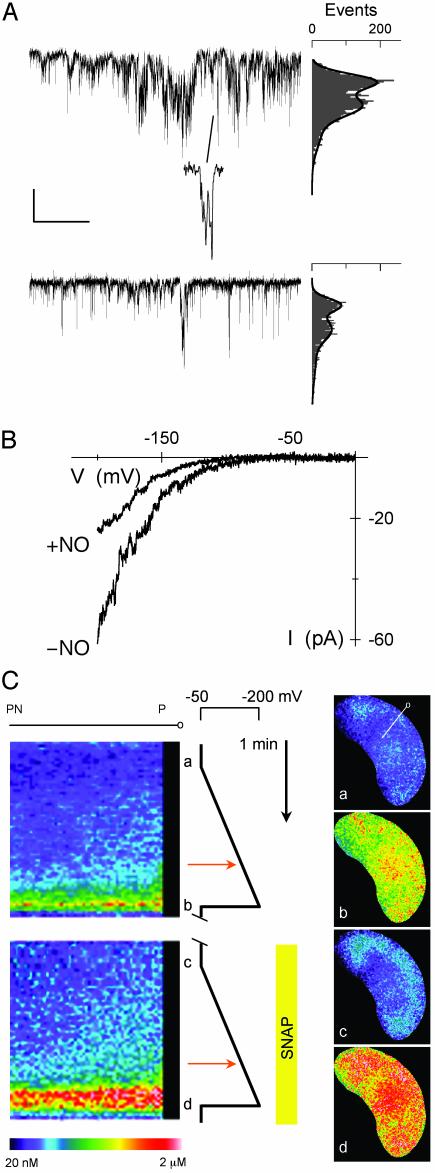
Fig. 5.
NO enhances evoked [Ca2+]i increases without promoting Ca2+-channel activity at the plasma membrane. (A) Cell-attached, single Ca2+-channel records from one guard cell protoplast before (Top) and 2 min after (Bottom) adding 10 μM SNAP. (Middle) Expanded time scale showing single opening events. [Scale: horizontal, 1 s (50 ms, Middle); vertical, 2 pA.] Point-amplitude histograms (Right), which plot the number of openings and their mean amplitude (the vertical axis is scaled to traces) for 10-s periods, including segments shown, indicate an ≈2-fold decrease in opening events. (B) Whole-cell Ca2+ currents recorded during voltage ramps before and 2 min after adding 10 μM SNAP (see ref. 18). (C) Kymograph (Left) of voltage evoked [Ca2+]i rise in one intact guard cell recorded by fura 2 fluorescence ratio at 2-s intervals before and 2 min after adding 10 μM SNAP. The time line (Center) runs top to bottom with voltage scale and ramps as indicated. Selected ratio images (Right,a–d) correspond to time points indicated. The kymograph was constructed from successive ratio images averaged over a 2-pixel-wide band (line in Right, a) from cell exterior and periphery (P) to the perinuclear region (PN). Voltage ramps from -50 mV to -200 mV over 90 s. The threshold for [Ca2+]i rise was determined as time of [Ca2+]i rise 1 SD above the pre-ramp level to a depth of 3 pixel units (≈2 μm). Thresholds (red arrows, Center): -NO, -138 mV; +SNAP, -143 mV.

