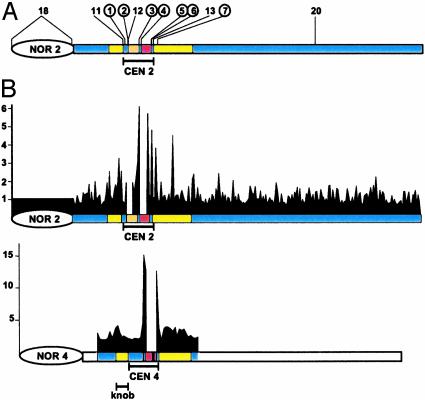
Fig. 3.
Strand-biased methylation across chromosomes 2 and 4. Shown are scale drawings of chromosome 2 and a portion of chromosome 4, depicting rDNA (NOR2,4), the genetically defined centromeres (CEN2,4), pericentromeric regions including the chromosome 4 knob (yellow), a mitochondrial insertion in CEN2 (orange), and the 180-bp repeat array (red) (25). (A) Circles, regions with significantly different methylation levels between the two complementary strands. (B) Abundance of hemimethylated Sau3A sites along 255 BAC and P1 clones spanning chromosome 2 and 43 BAC clones surrounding CEN4; gaps correspond to unsequenced portions of the chromosome (25, 33). Relative signals from nick translation products after a Sau3A and MboI digests are plotted on the vertical axis.

