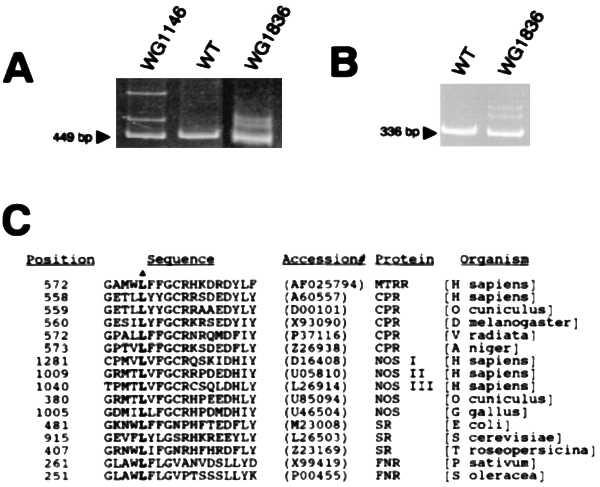
Figure 7.

Mutation analysis of cblE patient cell lines. (A) PCR products obtained with primers Z116/Z117 from RT reactions with control sample (WT) and two cblE cell lines. For cell lines WG1146 and WG1836, the bands above the 449 bp amplification product are due to heteroduplexes formed between DNA strands bearing different allelic sequences. The pattern for WG1146 was also seen with WG788 (data not shown). (B) RT-PCR products amplified with primers AB586/AB588 from a control sample and WG1836. Heteroduplexes are observed above the 336-bp segment for WG1836. (C) Sequence comparison among proteins of the FNR family in a part of the NADPH binding region in the vicinity of the leucine residue that is deleted in a cblE patient (denoted by a triangle). Representative examples are shown [MTRR, methionine synthase reductase; CPR, cytochrome P-450 reductase; NOS, NO synthase, SR, sulfite reductase; and FNR, NADPH-ferredoxin (flavodoxin) reductase].
