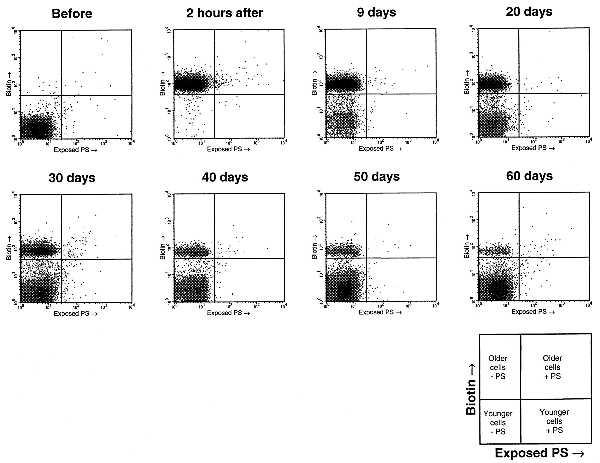
Figure 1.

Density plots of exposed PS (measured by FITC fluorescence) vs. biotin (measured by PE fluorescence) in red cells before and after irreversible in vivo biotinylation (rabbit 2). The quadrants indicate cutoffs for determining biotinylation and exposed PS. Notice that biotinylated cells steadily decrease in number after biotinylation, and a greater proportion of them have exposed PS than do nonbiotinylated cells. These experiments were done in duplicate assays (only one shown) for both rabbit 1 and rabbit 2.
