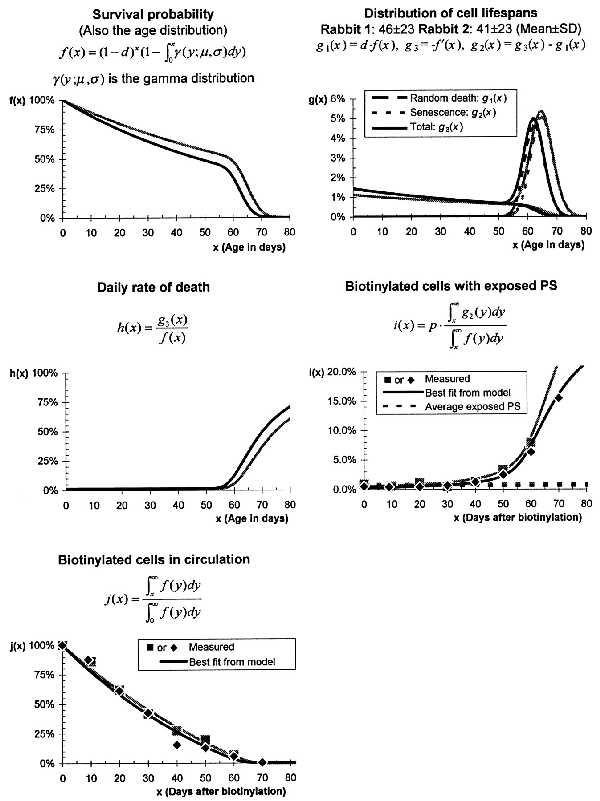
Figure 3.

Red cell aging in rabbit 1 (gray points and curves) and rabbit 2 (black points and curves). The parameters shown in Table 1 characterizing these curves were fitted to the experimental data [i(x) and j(x) above] and agree with results from Brown and Eadie (17). The best fit curves for i(x) and j(x) match the experimental data closely (r2 > 0.98).
