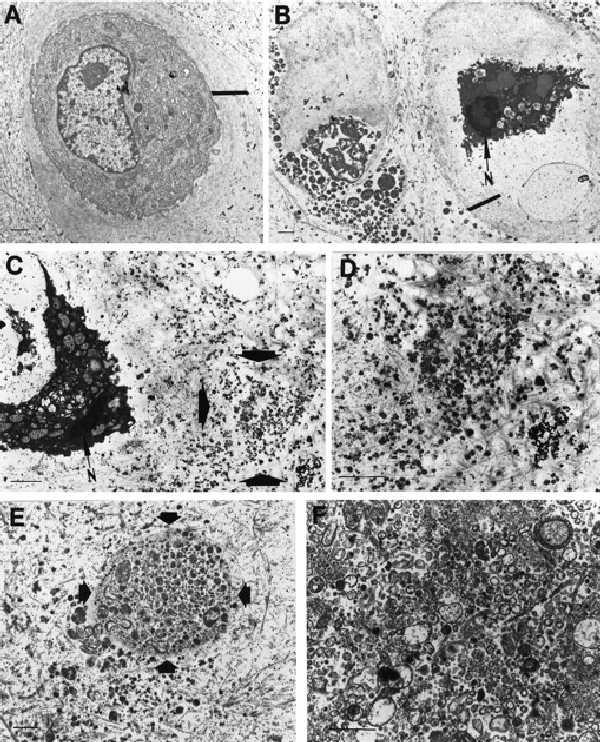
Figure 1.

Electron microscopy of apoptotic bodies and matrix vesicles from normal and SNP-treated cartilage. (A) Electron micrograph of a chondrocyte from normal articular cartilage. (×5,400.) Small bar represents 1 μm. Large bar defines pericellular matrix. (B) Two adjacent apoptotic chondrocytes in SNP-treated cartilage. N = nucleus. (×4,300.) Small bar represents 1 μm. Large bar defines pericellular matrix. (C) Apoptotic chondrocyte in SNP-treated cartilage with apoptotic bodies accumulating in the cartilage matrix (area marked by arrows). (×8,500.) (D) High-magnification view of the area indicated by the arrow in C. (×14,800.) (E) Apoptotic bodies in chondrocyte lacuna marked by arrow. (×7,500.) (F) Apoptotic bodies isolated by ultracentrifugation from SNP-treated cartilage. (×15,000.) (Bars = 1 μm.)
