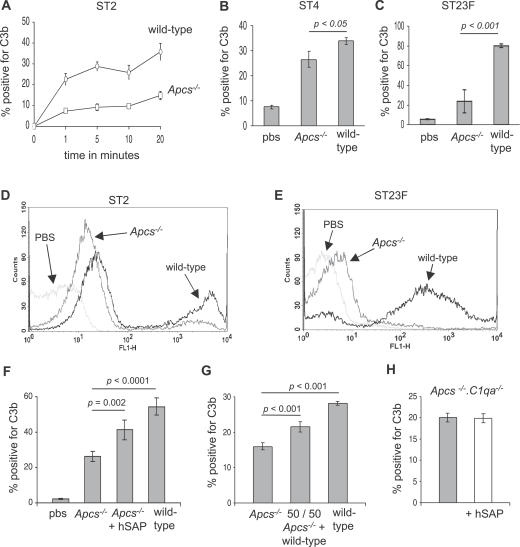
Figure 2. Effects of SAP on C3b Deposition on S. pneumoniae Measured Using Flow Cytometry.
(A) Time course of the proportion of ST2 S. pneumoniae bacteria positive for C3b after incubation in serum from wild-type and Apcs−/− mice. For the comparison of results for wild-type versus Apcs−/− mice, p < 0.001 at all time points from 1 to 20 min.
(B and C) Proportion of ST4 (B) and ST23F (C) S. pneumoniae bacteria positive for C3b after incubation for 20 min in serum from wild-type and Apcs−/− mice.
(D and E) Examples of flow cytometry histograms of C3b deposition on ST2 (D) and ST23F (E) S. pneumoniae strains after incubation in PBS or serum from wild-type or Apcs−/− mice.
(F) Effect on the proportion of ST2 S. pneumoniae positive for C3b of addition of 10 μg/ml hSAP to serum from Apcs−/− mice.
(G) Effect on the proportion of ST2 S. pneumoniae positive for C3b of addition of an equal volume of serum from wild-type mice to serum from Apcs−/− mice.
(H) Effect of addition of hSAP (50 μg/ml, white column) on C3b deposition on the ST2 S. pneumoniae strain in serum from Apcs −/− .C1qa −/− mice. Grey columns, results for Apcs −/− .C1qa −/− serum; white columns, results for Apcs −/− .C1qa −/− serum in the presence of hSAP.
For panels (A–C) and (F–H), error bars represent SDs, and in (A) when not visible are too small to be seen outside of the symbol. p-Values are calculated using 2-tailed t tests.

