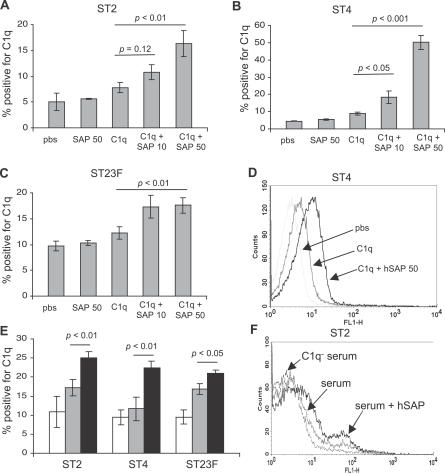
Figure 3. Effects of SAP on C1q Binding to S. pneumoniae Measured Using Flow Cytometry.
(A–C) Proportion of ST2 (A), ST4 (B), and ST23F (C) S. pneumoniae bacteria positive for C1q after incubation in 90 μg/ml human C1q with or without addition of 10 or 50 μg/ml hSAP.
(D) Example of flow cytometry histograms of C1q binding to ST4 S. pneumoniae after incubation in 90 μg/ml human C1q with or without addition of 50 μg/ml hSAP.
(E) Proportion of S. pneumoniae positive for C1q after incubation in human serum with (black shading) or without (grey shading) addition of 50 μg/ml hSAP, using C1q-depleted serum (white shading) as a negative control.
(F) Example of flow cytometry histograms of C1q binding to ST2 S. pneumoniae after incubation in human serum with or without addition of 50 μg/ml hSAP.
For panels (A–C) and (E), error bars represent SDs, and p-values are calculated using 2-tailed t tests.

