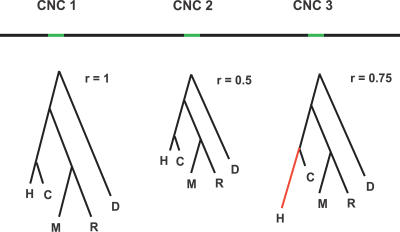
Figure 1. Schematic Illustration of Our Method Applied to Three CNCs.
The tree beneath each CNC shows hypothetical branch lengths for the phylogeny connecting human, chimpanzee, mouse, rat, and dog (H, C, M, R, and D, respectively). Each CNC is associated with a single rate parameter r that accounts for variation in the local mutation rate and level of conservation; however, under the null model, the relative branch lengths are all the same. CNC 3 has an unusually long human branch suggesting positive adaptation on the human lineage.

